Marketing Ideas for Accounting Firms: 2026 Growth Guide
Discover proven marketing strategies for accounting firms. Learn how to attract clients through SEO, content, and digital tactics that drive measurable growth.
May 15, 2026


Conversion rate is one of those numbers every Shopify store owner watches, but few fully trust. You check it, compare it to an average you saw somewhere online, and wonder whether you’re doing fine or quietly falling behind.
The problem is that a “good” conversion rate on Shopify isn’t a single number you can aim for and forget. It depends on what you sell, how people find your store, and how much thinking your product requires before someone clicks Buy. This article breaks down what a good Shopify conversion rate actually looks like in practice, how benchmarks should be used, and where they often mislead more than they help.
At its core, conversion rate answers one basic question: how often does a visit to your store result in a purchase?
Shopify defines conversion rate as the percentage of sessions that result in an order.
Sessions with orders ÷ Total sessions × 100.
This means if one session leads to multiple orders, it is still counted as a single converted session.
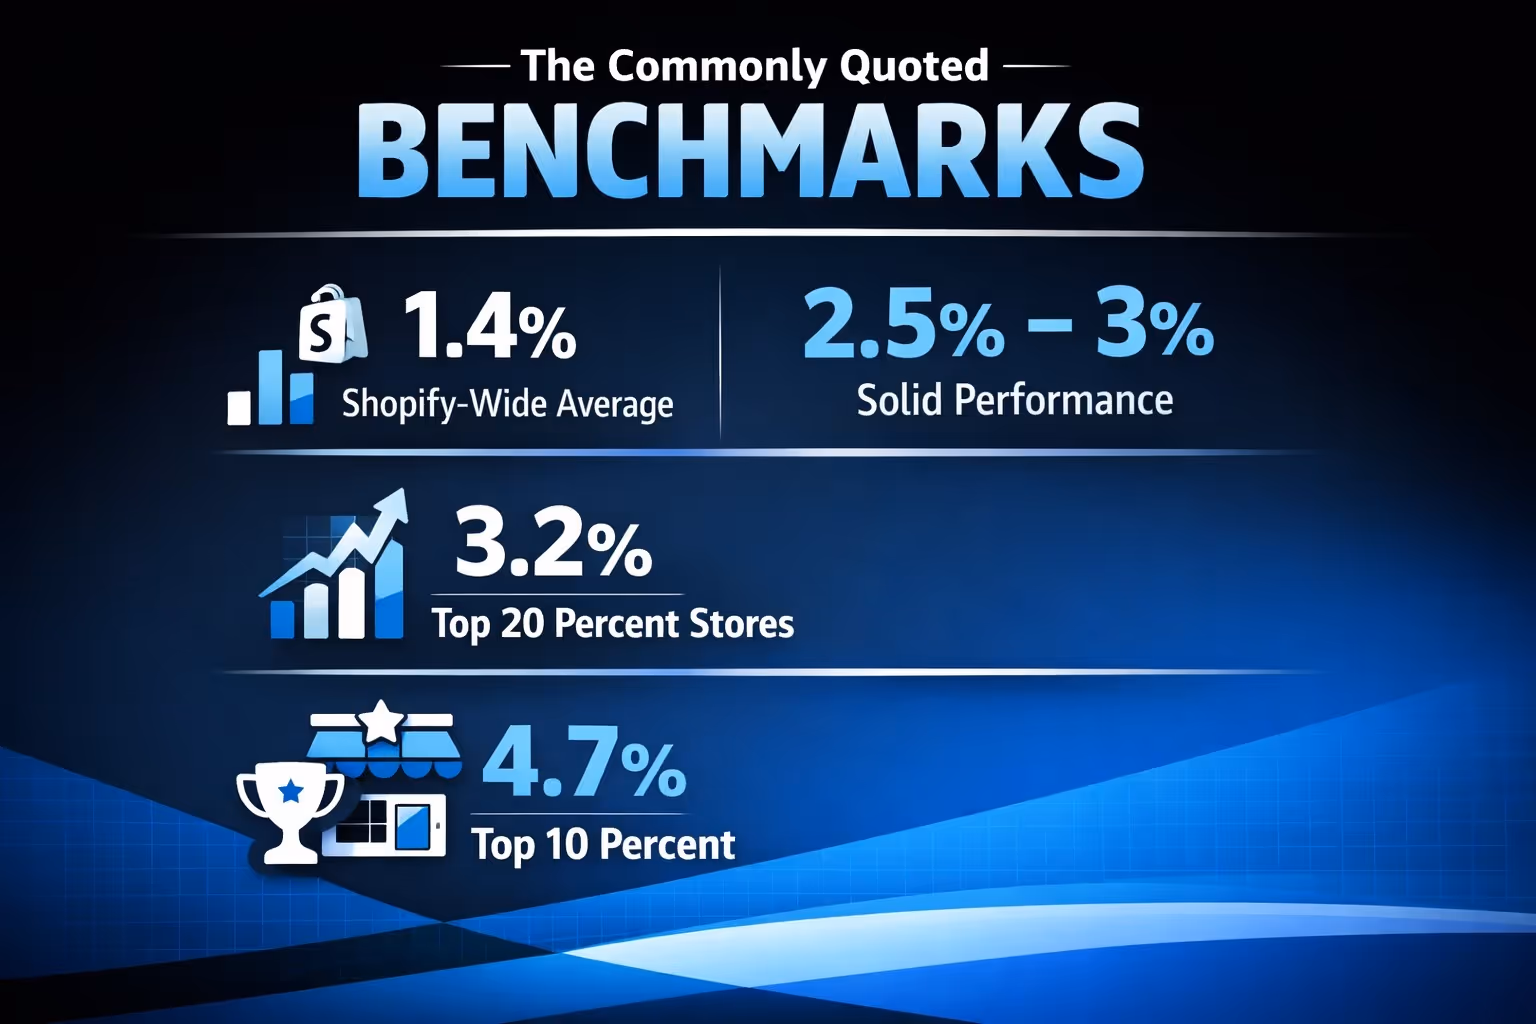
You will often see these ranges cited:
These numbers are not wrong. But they are incomplete.
Averages combine thousands of stores with wildly different products, price points, traffic sources, and business models. A one-product impulse store and a high-ticket electronics brand both end up in the same dataset.
That is like averaging the fuel efficiency of motorcycles and trucks and calling it a driving standard.
Benchmarks are useful as context. They are dangerous as goals.
It sounds counterintuitive, but a lower conversion rate does not automatically mean a worse business.
Imagine two stores:
Which store is healthier?
Without looking at revenue per visitor, customer lifetime value, margins, and growth trajectory, the conversion rate alone tells you very little.
In fact, some fast-growing Shopify stores intentionally accept lower conversion rates because they are introducing new customers at scale. Education, consideration, and trust-building take time. That shows up as more sessions before purchase and a lower headline conversion rate.
Chasing a higher percentage without understanding why your current number looks the way it does can lead to the wrong optimizations.
One of the biggest factors behind conversion rate is where your traffic comes from.
Different channels behave very differently:
If you increase ad spend aggressively, your conversion rate may drop even if revenue grows. That is not a failure. It is a tradeoff.
This is why comparing your store to a generic benchmark without matching traffic mix is misleading. A store driven by email and loyalty programs should convert higher than a store focused on acquisition through paid social. Expecting otherwise sets unrealistic expectations.

Traffic quality only becomes a conversion problem when ads promise one thing and the landing experience delivers another. That gap is where performance usually breaks.
At Extuitive, we focus on ads first. We help teams create, validate, and launch ads that match real user intent before spend scales. Our AI agents generate multiple ad concepts, visuals, hooks, and price cues, then pressure-test them against simulated consumer behavior to see what actually holds attention and drives action.
Instead of guessing which creative will work, we test what resonates with different traffic types. Cold paid traffic, retargeting audiences, and high-intent users each respond to different signals. Our system surfaces which ads set the right expectations and which ones inflate clicks but hurt conversion.
This approach changes how conversion rate behaves. When ads are validated before launch, traffic arrives better aligned. Fewer visitors bounce. Fewer sessions are wasted. Conversion rate becomes more stable, even as acquisition grows.
For us, high-performing ads are not just about clicks. They are about creating the right first promise, validating it before scale, and launching with confidence that the traffic you attract actually has a reason to convert.
Another reason the answer is not simple is price.
As a general pattern, conversion rates tend to decline as price increases. Customers think longer. They compare alternatives. They leave and come back.
Many Shopify stores see noticeable drop-offs when prices cross certain thresholds, often around 50 dollars, 150 dollars, and again at higher tiers. These are not rules. They are patterns tied to how people perceive risk.
If you sell higher-priced products, a lower conversion rate does not automatically signal a problem. It often signals a longer decision cycle.
This is also why sessions matter more than users in analytics. A customer who visits five times before buying still counts as one order across five sessions.
Mobile traffic dominates ecommerce. Mobile conversions often lag behind desktop.
This is not always a design failure. It is behavioral.
People browse on phones while distracted. They save products for later. They switch devices. They compare while commuting or watching TV.
A store with a lower mobile conversion rate but strong desktop performance is not necessarily broken. What matters is whether mobile supports discovery and return visits effectively.
Looking at blended conversion rate without breaking it down by device hides this nuance.
Returning visitors often convert two to three times better than new ones. This single fact explains many conversion rate mysteries.
If your store has a high share of returning visitors, your conversion rate will naturally look stronger. If you are early-stage, scaling traffic, or entering new markets, it will look weaker.
Neither scenario is inherently better. They represent different stages of growth.
This is why it is dangerous to compare a mature brand with a loyal audience to a newer store focused on acquisition. The numbers are measuring different realities.
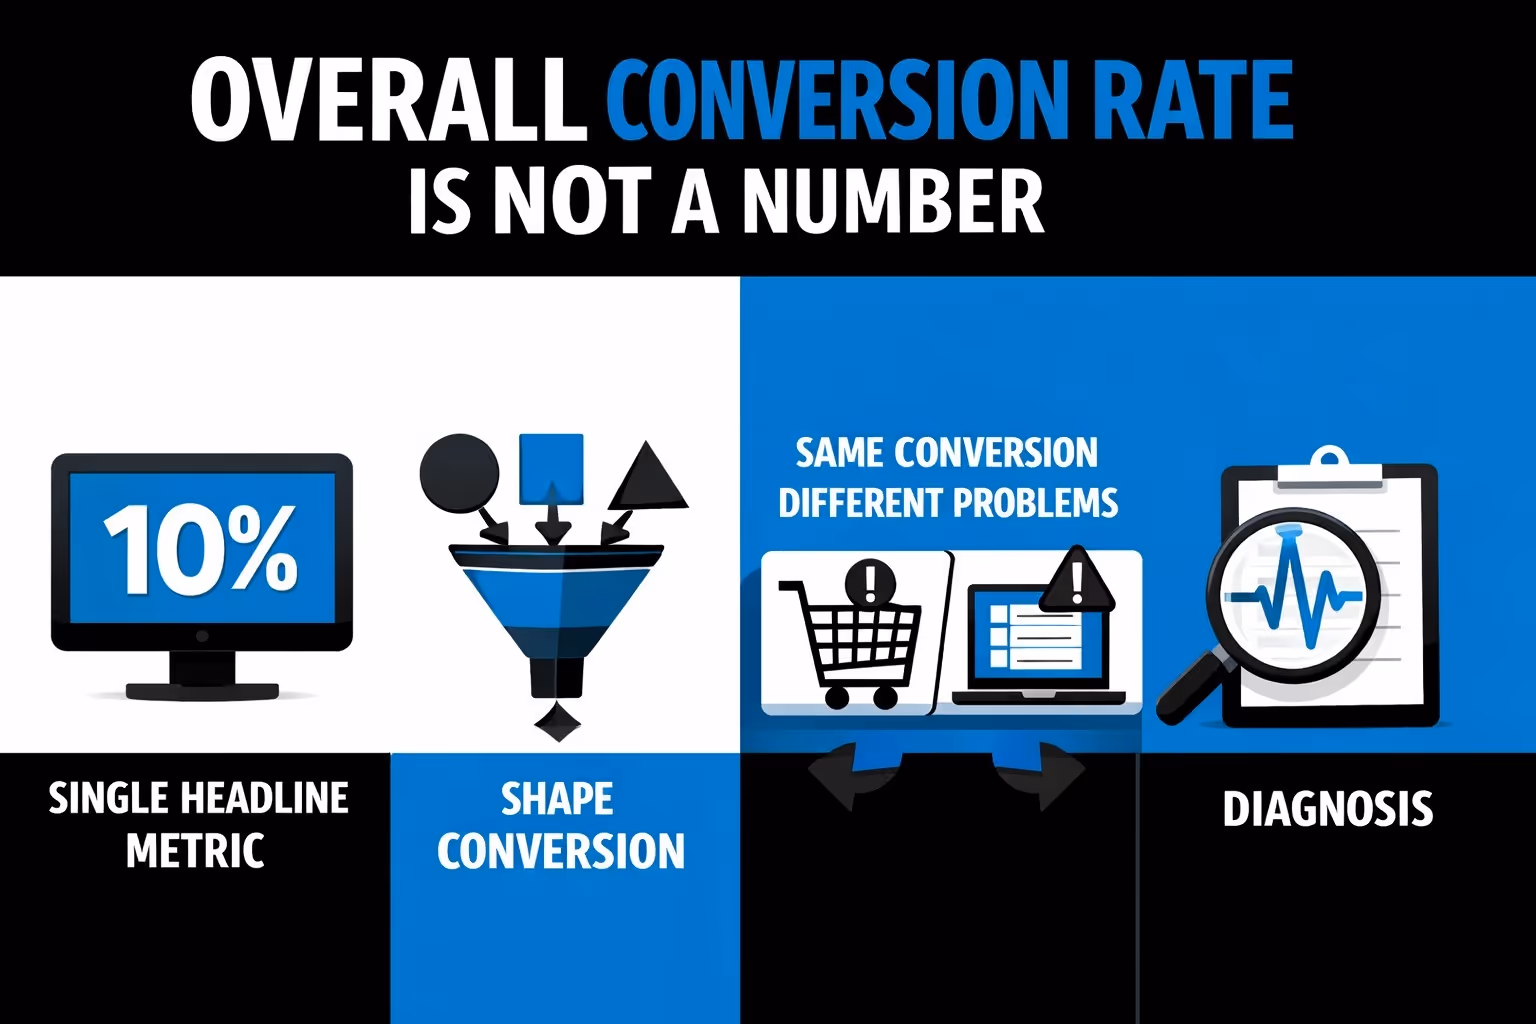
Many Shopify dashboards show one conversion rate number front and center. That simplicity is convenient. It is also incomplete. A single percentage can hide more than it reveals, especially when you are trying to understand why performance changed or stalled.
Underneath the final conversion rate are several micro-actions that happen earlier in the journey:
Each step answers a different question about how visitors behave once they arrive.
Two stores can report the same conversion rate and still have entirely different issues.
One store might struggle to get visitors to add products to the cart. Another might lose customers at the shipping step. A third might see strong intent but friction during checkout. The final percentage looks identical, but the underlying causes are not.
When you focus only on the final conversion rate, you miss where improvement actually lives. Real gains usually come from fixing a specific break in the journey, not from surface-level tweaks.
This is also why conversion rate optimization is not about tricks or hacks. It is about understanding where people hesitate, where they drop off, and why. Until you know that, the percentage itself does not tell you what to do next.
Some common misunderstandings create false confidence or unnecessary panic.
Holidays, major sales events, and product launches can push conversion rates up or down almost instantly. These swings often look dramatic in analytics, but they usually reflect timing, not structural change.
During peak buying seasons, intent is naturally higher. People arrive with a goal in mind. They are already planning to spend, which shortens decision cycles and lifts conversion rates across most stores. The same site, the same products, and the same checkout can suddenly look like they are performing far better.
During slower periods, the opposite happens. Visitors browse, compare, and delay decisions. They may save products, sign up for emails, or come back later. Conversion rates fall, even if overall interest in the brand remains healthy.
Neither period defines your store. They define context.
Smart analysis compares like with like. Campaign periods should be measured against previous campaigns. Seasonal windows should be reviewed year over year. Comparing a holiday spike to a random baseline almost always leads to the wrong conclusions.
Benchmarks are useful when they help you ask better questions, not when they pretend to deliver final answers.
They work best when the comparison is meaningful. That means the same industry, a similar price range, and roughly comparable traffic sources. In those cases, benchmarks can highlight whether your store behaves differently from peers facing similar conditions.
They stop being helpful when they are treated as universal standards.
If your store sells niche or high-consideration products, comparing yourself to broad Shopify averages often creates unnecessary frustration. The buying journey is longer, and that naturally lowers headline conversion rates. On the other hand, if you sell low-cost, impulse-friendly items, settling for an average benchmark may hide real upside you could be capturing.
Used correctly, benchmarks open conversations. Used incorrectly, they shut down thinking. They should point you toward deeper analysis, not replace it.
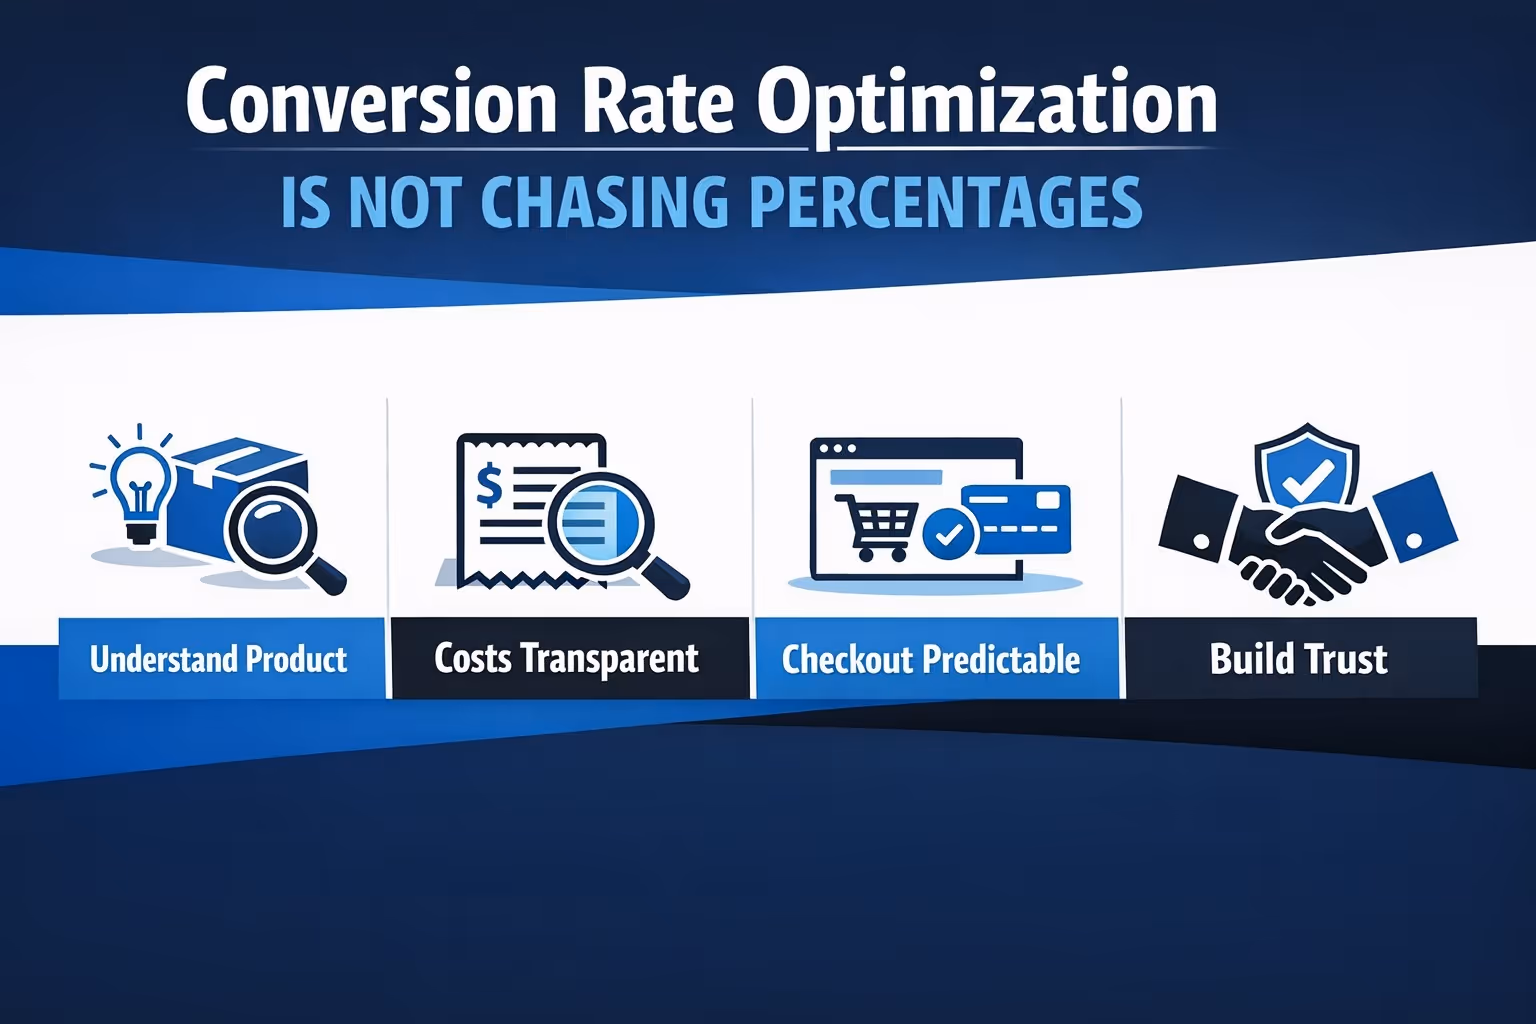
The most successful Shopify merchants do not obsess over hitting a magic number. They focus on reducing friction.
As a result, conversion rates improve naturally. Not because someone demanded 3 percent, but because fewer visitors fall out for avoidable reasons.
That mindset scales. Percentage chasing does not.
If your store has consistent traffic and your conversion rate has plateaued, structured optimization can unlock meaningful gains.
Especially for stores already performing above average, small improvements compound quickly. Moving from 3.2 percent to 4 percent can be worth more than doubling traffic.
That said, optimization only works when grounded in data and patience. Testing, learning, and iteration matter more than bold redesigns or copy overhauls.
Conversion rate is not a switch. It is a system response.
A good conversion rate on Shopify is not a fixed target. It is a moving indicator shaped by traffic, price, product, and context.
Averages can guide you, but they cannot define you. Numbers matter, but interpretation matters more.
If there is one takeaway, it is this: stop asking whether your conversion rate is good in isolation. Start asking whether it makes sense for how your store actually works.
That shift changes everything.


